Episode 10 · VLF and Solar Flares · Series 01: The Listening Station
How does a very low frequency signal show a solar flare?
 Coming soon
- Release
- Length
- 3:12
- On the dial
- near 25 kHz
- Signal
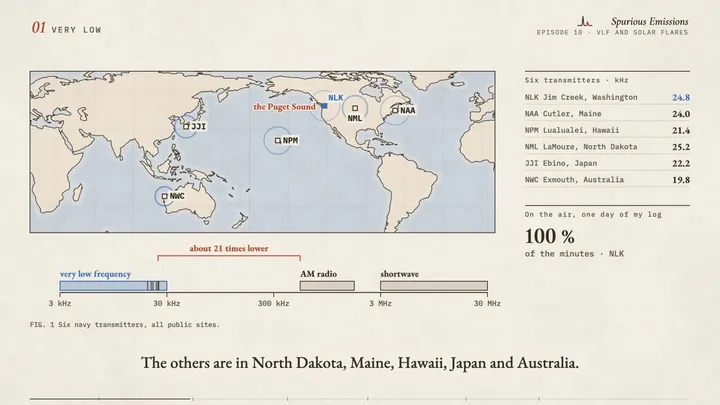
- Navy VLF transmitters
What it covers
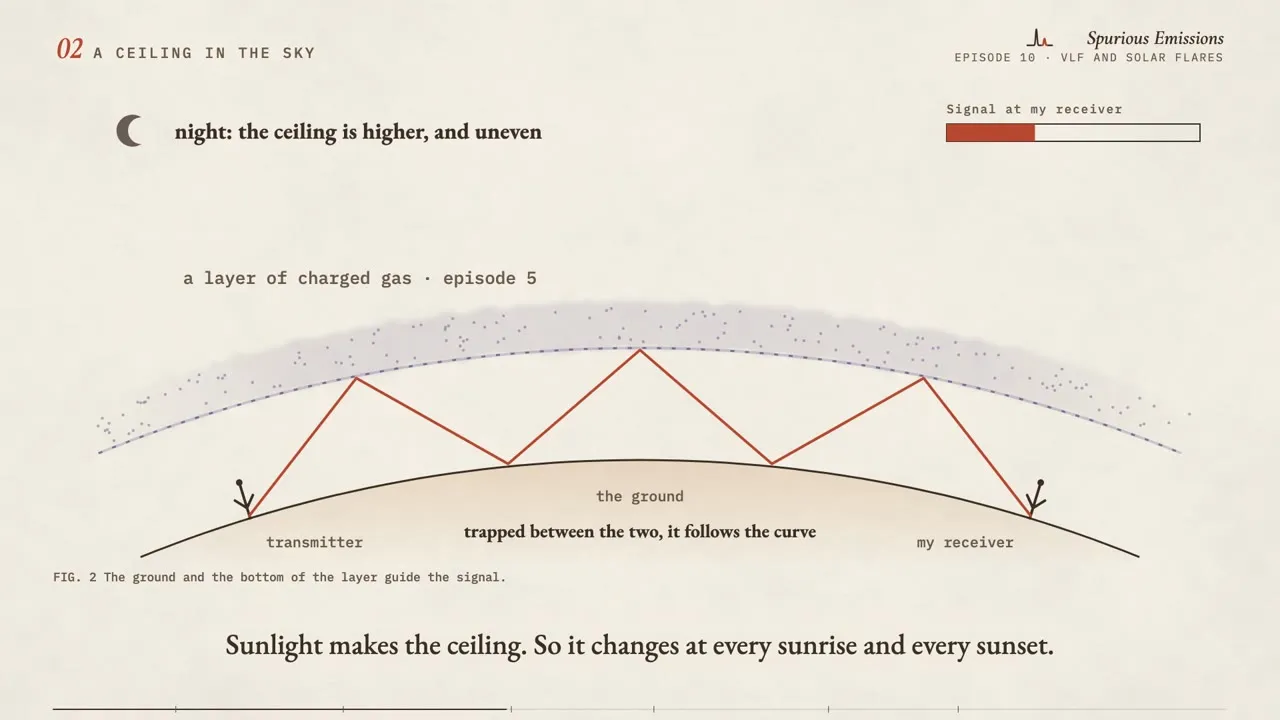
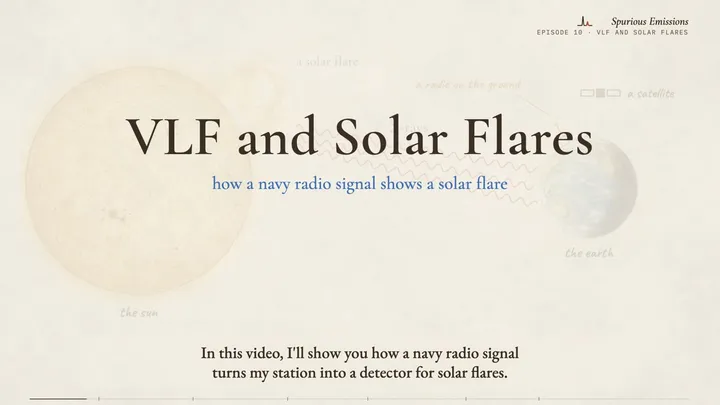
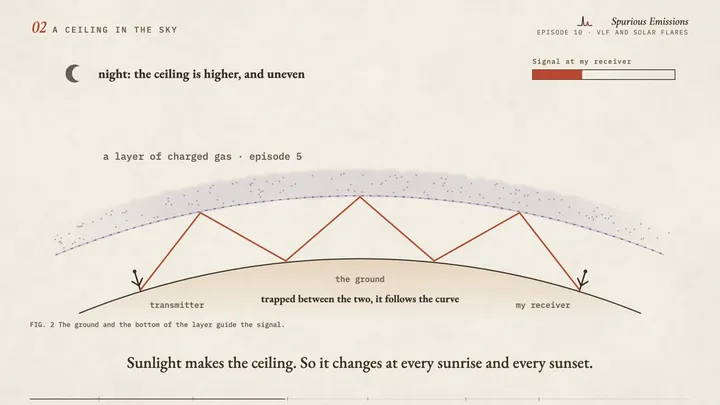
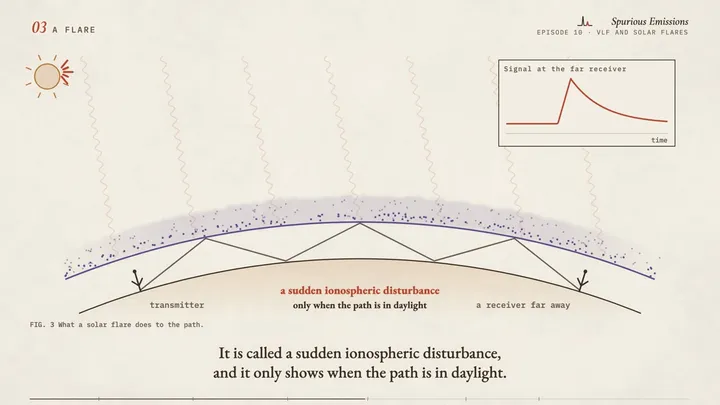
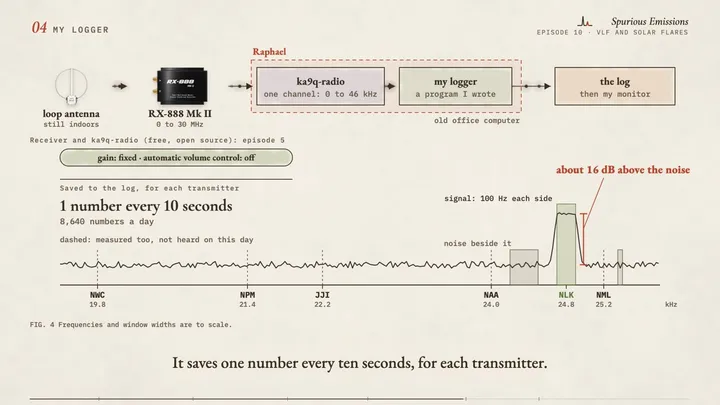
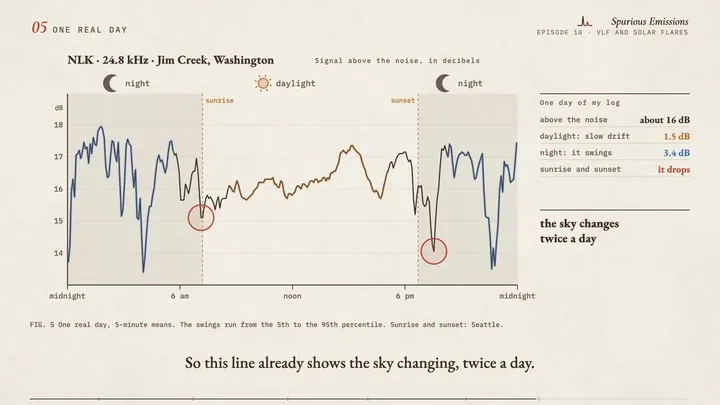
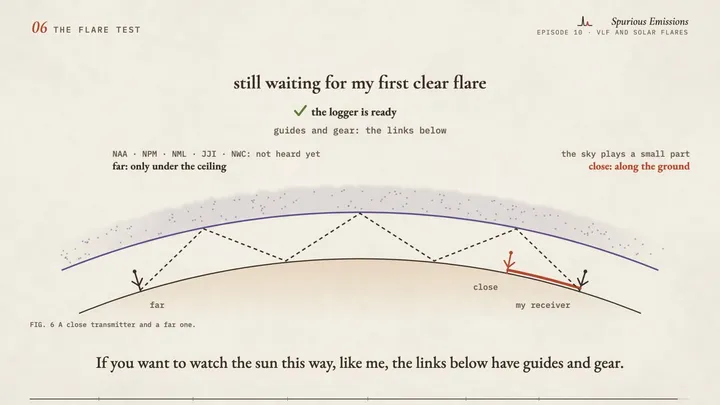
A solar flare can show up on a plain radio. Navies talk to submarines with very low frequency radio. That signal travels between the ground and the bottom of a layer in the sky, and a flare changes that layer within minutes. I explain how that works, how a small program of mine measures six navy transmitters once a second, and what one real day of my log shows next to the X-rays that a NOAA satellite measured. I will be honest: the flare of that day left no clear mark, and I explain why.
Chapters
- 0:00Intro
- 0:21Very low
- 0:49A ceiling in the sky
- 1:16A flare
- 1:40My logger
- 2:09One real day
- 2:30The flare test
Frames from the draft
Gear in this episode
| RX-888 Mk II | the receiver that hears all of shortwave at once (mine is from OpenSourceSDRLab) |
| MLA-30+ loop antenna | the small active loop antenna for shortwave |
| HP EliteDesk small form factor PC | the shortwave computer I call Raphael (mine was rescued from e-waste) |
| CyberPower CP1500PFCLCD UPS (1500 VA, sine wave) | the battery backup that keeps almost all of my station running through a power cut |
Software and references
| NOAA Space Weather Prediction Center: GOES X-ray fluxswpc.noaa.gov | the sun's X-rays, measured by satellite, live and free. My monitor reads this data |
| Stanford SOLAR Center: the SID space weather monitor programsolar-center.stanford.edu | how to detect solar flares with a very low frequency receiver, written for schools |
| NOAA: solar flares and radio blackoutsswpc.noaa.gov | what a flare does to the layer in the sky, and the flare classes |
| ka9q-radiogithub.com | the program that cuts the channel out of the receiver's stream (episode 5) |
What is simplified, and what is invented
- The logger is a program I wrote. It is not public, so there is no link.
- The curves in scenes 5 and 6 are one real day from my log, as 5-minute and 1-minute means, next to public NOAA data for the same day. The video shows the hour of the day and no date.
- On that day my line showed no clear mark of the flare. The small drop near the flare began before the X-rays rose, and drops of that size happen with no flare.
- That the drops at sunrise and sunset come from the layer forming and fading is the usual explanation. One day does not prove it.
- The X-ray curve is clipped at the bottom of its panel where the satellite data drops out for a few minutes.
- Sunrise and sunset are computed for Seattle. The map marks my region only, at Seattle, and the dashed lines start there.
- The side views of the earth and the layer are simplified and not to scale. The day and night heights of the layer are a sketch.
- The signal trace in scene 3 and the signal bar in scene 2 are illustrations, not measurements.
- In scene 4 the frequencies and the widths of the measuring windows are to scale. The noise and the shape of the hump are an illustration.
- Five of the six transmitters were not heard on that day. My antenna is a small loop that is still indoors.
- World coastline: Natural Earth (public domain).