Episode 12 · The Station Monitor · Series 01: The Listening Station
How do I watch everything on one screen?
 Coming soon
- Release
- Length
- 3:33
- On the dial
- The wall
What it covers
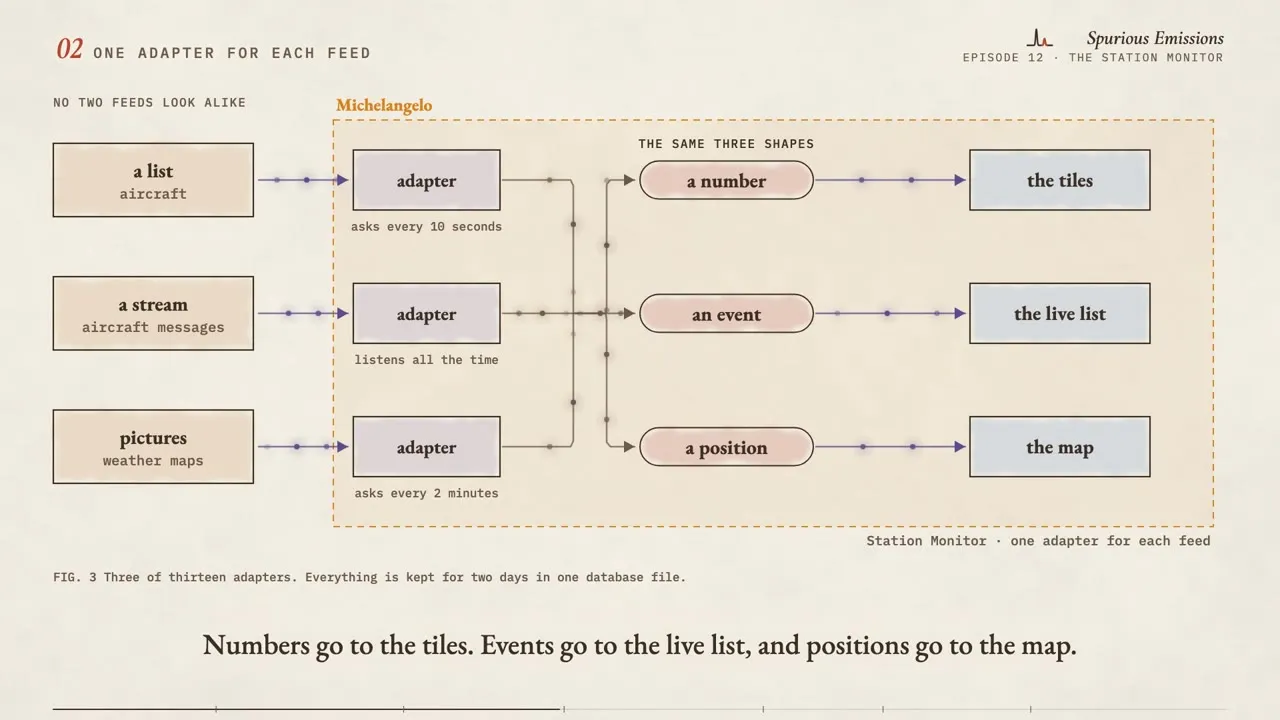
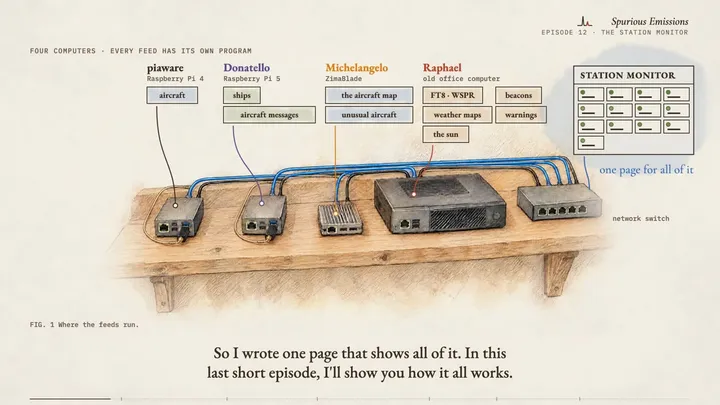
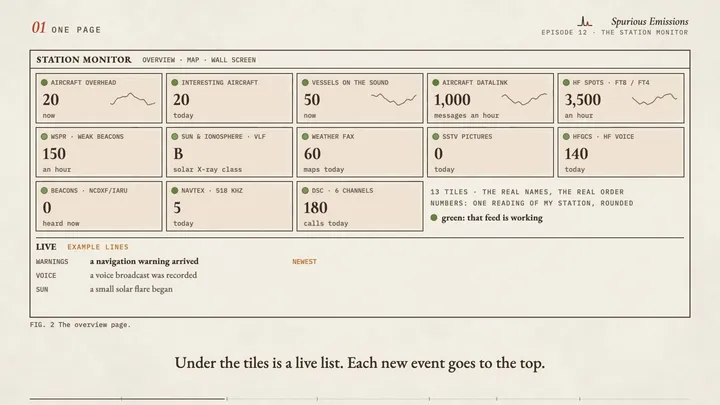
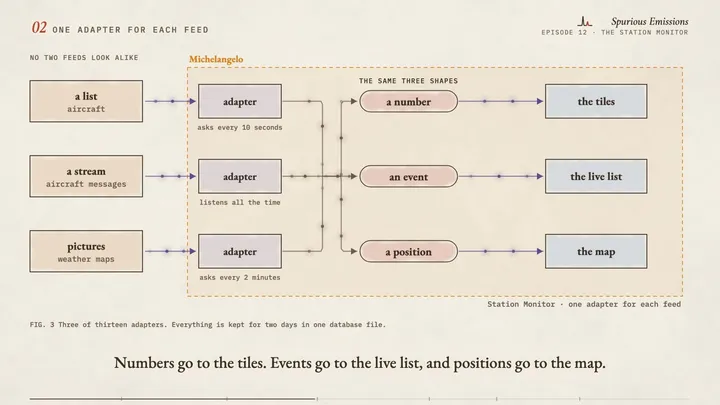
I wrote one dashboard for my whole radio listening station: aircraft, ships, shortwave radio, weather maps and the sun on one web page. Every feed has its own program on its own computer, so I explain the one idea behind the page (a small adapter for each feed), how it knows that a feed has died, the map and the 30-day archive, and the mode for a screen on the wall. It is a hobby program, and I say what is not finished.
Chapters
- 0:00Intro
- 0:31One page
- 1:05One adapter for each feed
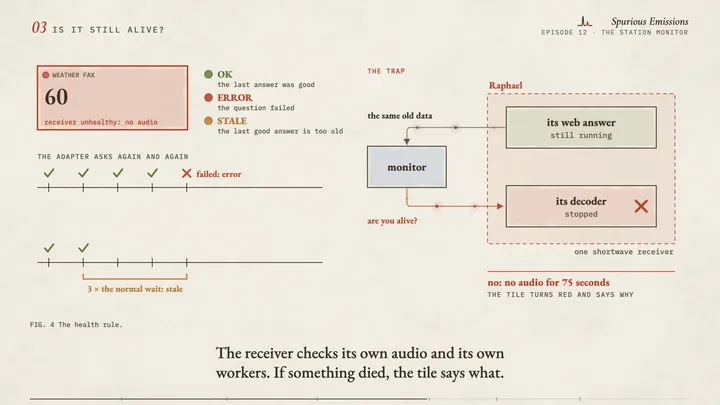
- 1:34Is it still alive?
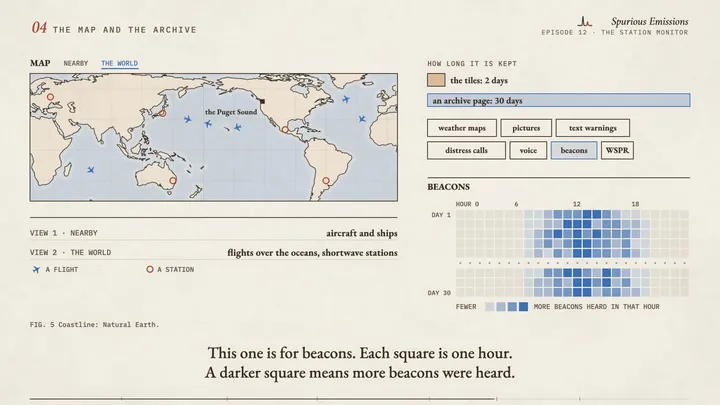
- 2:11The map and the archive
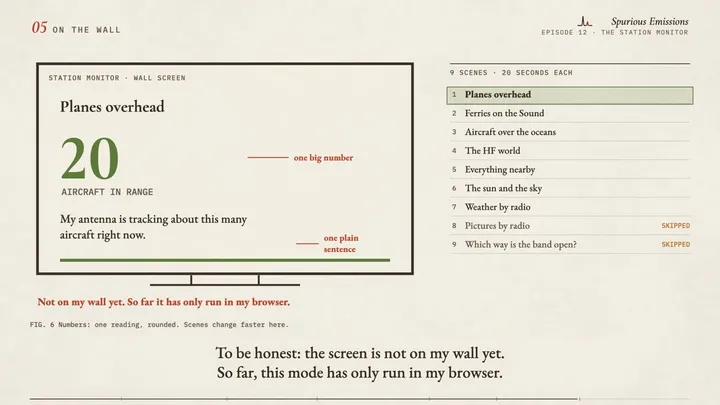
- 2:33On the wall
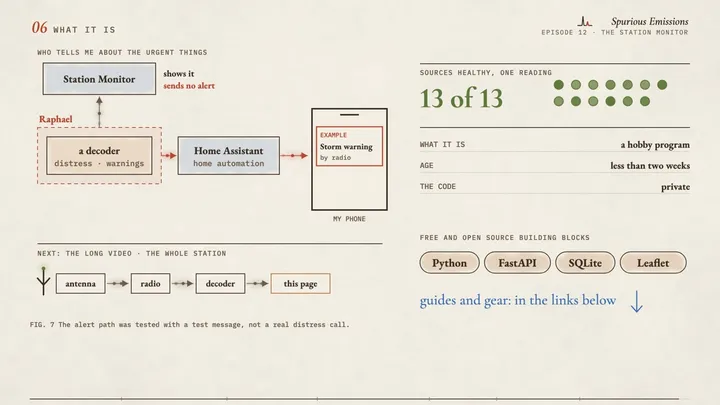
- 3:00What it is
Frames from the draft
Gear in this episode
| ZimaBlade | the small server I call Michelangelo |
| RX-888 Mk II | the receiver that hears all of shortwave at once (mine is from OpenSourceSDRLab) |
| Raspberry Pi 4 | the small computer that runs my ADS-B receiver |
| Raspberry Pi 5 | the small computer that runs the decoder |
| HP EliteDesk small form factor PC | the shortwave computer I call Raphael (mine was rescued from e-waste) |
| CyberPower CP1500PFCLCD UPS (1500 VA, sine wave) | the battery backup that keeps almost all of my station running through a power cut |
Software and references
| FastAPIfastapi.tiangolo.com | the Python web framework that serves the page and its data |
| SQLitesqlite.org | the one-file database that keeps the last two days |
| Leafletleafletjs.com | the map library behind the map page |
| Pythonpython.org | the language the program is written in |
| Home Assistanthome-assistant.io | the home automation system that sends the urgent alerts to my phone |
What is simplified, and what is invented
- Station Monitor is my own program. Its code is private, so there is no link to it.
- Every picture of the page in this video is a drawing, not a screenshot. The real page has other colors and fonts. The drawing keeps the real tile names and their order.
- The numbers in the drawn tiles and wall scenes are one reading of my station, rounded. The trend lines are illustrations.
- Every line in the live list, the takeover card and the reason text on the red tile are examples that I wrote. I do not show real received messages, aircraft, vessels or call signs.
- "Asks again and again" is true for twelve of the thirteen adapters. The one for aircraft messages listens to a stream.
- The health timeline shows the rule. It is not a recording of a real fault.
- The marks on the world map are examples placed by hand, not received positions. Map coastline: Natural Earth (public domain).
- The archive calendar pattern is invented. Not every archive holds thirty days yet: the program is too young.
- The wall scenes change faster in the video than the real twenty seconds, and the real scenes also have a map or a picture behind the number.
- The phone alerts for distress calls were tested with a test message. My station has not received a real distress call.